
SAM Economic Models
GEOPHIRES SAM Economic Models leverage NREL’s SAM Financial Models by transforming GEOPHIRES parameters into SAM parameters and running the corresponding SAM model with PySAM.
SAM Single Owner PPA
Corresponding SAM Financial Model: Power Purchase Agreement (PPA): Single owner
Parameters
The following table describes how GEOPHIRES parameters are transformed into SAM parameters, as implemented in EconomicsSam.py. (Note that the source code implementation determines actual behavior in the case of any discrepancies.)
GEOPHIRES Parameter(s) |
SAM Category |
SAM Input(s) |
SAM Module(s) |
SAM Parameter Name(s) |
Comment |
|---|---|---|---|---|---|
|
Generation Profile |
|
|
|
|
|
Generation Profile |
|
|
|
|
|
AC Degradation |
|
|
|
Percentage difference of each year’s |
|
Installation Costs |
|
|
|
|
|
Operating Costs |
|
|
|
|
|
Operating Costs |
|
|
|
Royalty supplemental payments during the operational phase are added to the fixed operating cost according to the schedule. |
|
Operating Costs |
|
|
|
The royalty is modeled as a tax-deductible variable operating expense. GEOPHIRES uses the provided schedule, or calculates a schedule of $/MWh values based on the PPA price and Royalty Rate for each year, with optional escalation, escalation start year, and cap (maximum). This ensures the total annual expense in SAM accurately matches the royalty payment due on gross revenue. |
|
Financial Parameters → Analysis Parameters |
|
|
|
|
|
Financial Parameters → Analysis Parameters |
|
|
|
|
|
Financial Parameters → Analysis Parameters |
|
|
|
|
|
Financial Parameters → Project Tax and Insurance Rates |
|
|
|
GEOPHIRES does not have separate parameters for federal and state income tax so the rates are split from the combined rate based on an assumption of a maximum federal tax rate of 21% and the residual amount being the state tax rate. |
|
Financial Parameters |
|
|
|
|
|
Financial Parameters → Project Term Debt |
|
|
|
|
|
Financial Parameters → Project Term Debt |
|
|
|
|
|
Revenue |
|
|
|
GEOPHIRES’s pricing model is used to create a PPA price schedule that is passed to SAM. |
|
Revenue → Capacity Payments |
|
|
|
|
|
Incentives → Investment Tax Credit (ITC) |
|
|
|
Note that unlike the BICYCLE Economic Model’s |
|
Incentives → Production Tax Credit (PTC) |
|
|
|
|
|
Incentives → Production Tax Credit (PTC) |
|
|
|
|
|
Incentives → Production Tax Credit (PTC) |
|
|
|
If |
|
Incentives → Investment Based Incentive (IBI) |
|
|
|
Limitations
Only Electricity end-use is supported
Add-ons with electricity and heat are not currently supported. (Add-ons CAPEX, OPEX, and profit are supported.)
Carbon Revenue is not currently supported, but will be in future releases. See tracking issue for details.
Multiple Construction Years
Multiple Construction Years example web interface link
For projects with extended development timelines, GEOPHIRES SAM Economic Models improve financial accuracy by simulating the pre-revenue
construction phase.
SAM Economic Models account for the timing of capital deployment (Construction CAPEX Schedule), inflation, and Interest
During Construction (IDC)
based on the value of Construction Years parameter.
The simulation calculates a capitalized cost at the Commercial Operation Date (COD; Year 1), ensuring that the final
depreciation basis, debt sizing, and resulting metrics (LCOE, IRR, NPV) correctly reflect the time value of money during
construction.
See SAM Economic Models: Multiple Construction Years documentation.
Add-Ons
Add-Ons example web interface link
SAM Economic Models incorporate add-ons directly, unlike other GEOPHIRES economic models, which calculate separate extended economics. Total Add-on CAPEX is added to Total CAPEX. Total Add-on OPEX is added to Total operating and maintenance costs. Total AddOn Profit Gained per year is treated as fixed amount Capacity payment revenue.
Add-ons CAPEX, OPEX, and profit are supported. Add-ons with electricity and heat are not currently supported, but may be supported in the future.
Royalties
SAM Economic Models can model royalty agreements where compensation is paid to a third party (the “royalty holder”). GEOPHIRES supports two complementary mechanisms for these agreements: production-based royalties (a percentage of the project’s gross revenue) and supplemental royalty payments (a scheduled fixed cash flow, such as option payments or land leases).
From the perspective of the project developer (Single Owner), these payments are modeled as tax-deductible expenses to ensure accurate after-tax metrics (NPV, IRR, etc.). The two mechanisms are mapped to SAM differently:
Production-based royalties: GEOPHIRES translates the percentage rate into a year-by-year schedule for SAM’s Variable operating cost (
om_production) input, calculated against the PPA price to accurately reflect a cut of the gross revenue.Supplemental payments: These are split between the construction and operational phases. Payments made during construction are capitalized into the project’s basis (added to the total installed cost and debt-financed), while payments during the operational phase are treated as fixed O&M expenses (
om_fixed).Supplemental royalty payments example web interface link (also includes production-based royalties specified as a schedule)
Input Parameters:
Royalty Rate(production-based royalties): The percentage of the project’s gross annual revenue paid to the royalty holder. It can be optionally escalated by providingRoyalty Rate Escalationand capped withRoyalty Rate Maximum, starting atRoyalty Rate Escalation Start Year.Alternatively, you can provide
Royalty Rate Scheduleto explicitly define the rates over time using the scheduling syntax (see below), beginning at Year 1 (beginning of operations).
Royalty Supplemental Payments: A scheduled cash flow of absolute payments (in M$) made to the royalty holder. This is useful for modeling option payments, land leases, or minimum fixed royalties.Scheduling Syntax: Schedules are defined using a
<value> * <years>duration format. If a duration is omitted, that value becomes the terminal value and repeats for the remainder of the project.Example:
1.0 * 3, 0.1results in $1M/year for the first 3 years, dropping to $100k/year for all remaining years.Note: The
Royalty Supplemental Paymentsschedule begins at the first year of construction (unlikeRoyalty Rate Schedule) . If you wish to defer payments until operations begin, pad the front of your schedule with zeros (e.g.,0.0 * 2, 0.5for a 2-year construction period).
Royalty Holder Discount Rate(optional): The discount rate used to calculate the Net Present Value (NPV) of the royalty holder’s income stream. This is separate from the project’s main discount rate to reflect the different risk profiles of the two parties.
Output Parameters:
Cash Flow:
The production-based royalty rate schedule is displayed in the
Royalty rate (%)line item, and its corresponding dollar expense is included inO&M production-based expense ($).Operational supplemental payments are rolled into the
O&M fixed expense ($)line item. Pre-revenue supplemental payments are capitalized into the project’sInstalled cost ($).
Average Annual Royalty Cost: The developer’s average annual royalty expense over the project’s lifetime after construction is complete (Year 1). The same value is also output asRoyalty Holder Average Annual Revenue.Royalty Holder Total Revenue: The total gross (pre-tax), undiscounted royalty income over the project’s lifetime.Royalty Holder NPV: The pre-tax Net Present Value of the royalty holder’s income stream, calculated using theRoyalty Holder Discount Rate. This is a pre-tax value because the model does not account for the royalty holder’s specific tax liabilities.
Examples
Case Study: 500 MWe EGS Project Modeled on Fervo Cape Station
Documentation: Case Study: 500 MWe EGS Project Modeled on Fervo Cape Station.
SAM Single Owner PPA
SAM Single Owner PPA: 400 MWe BICYCLE Comparison
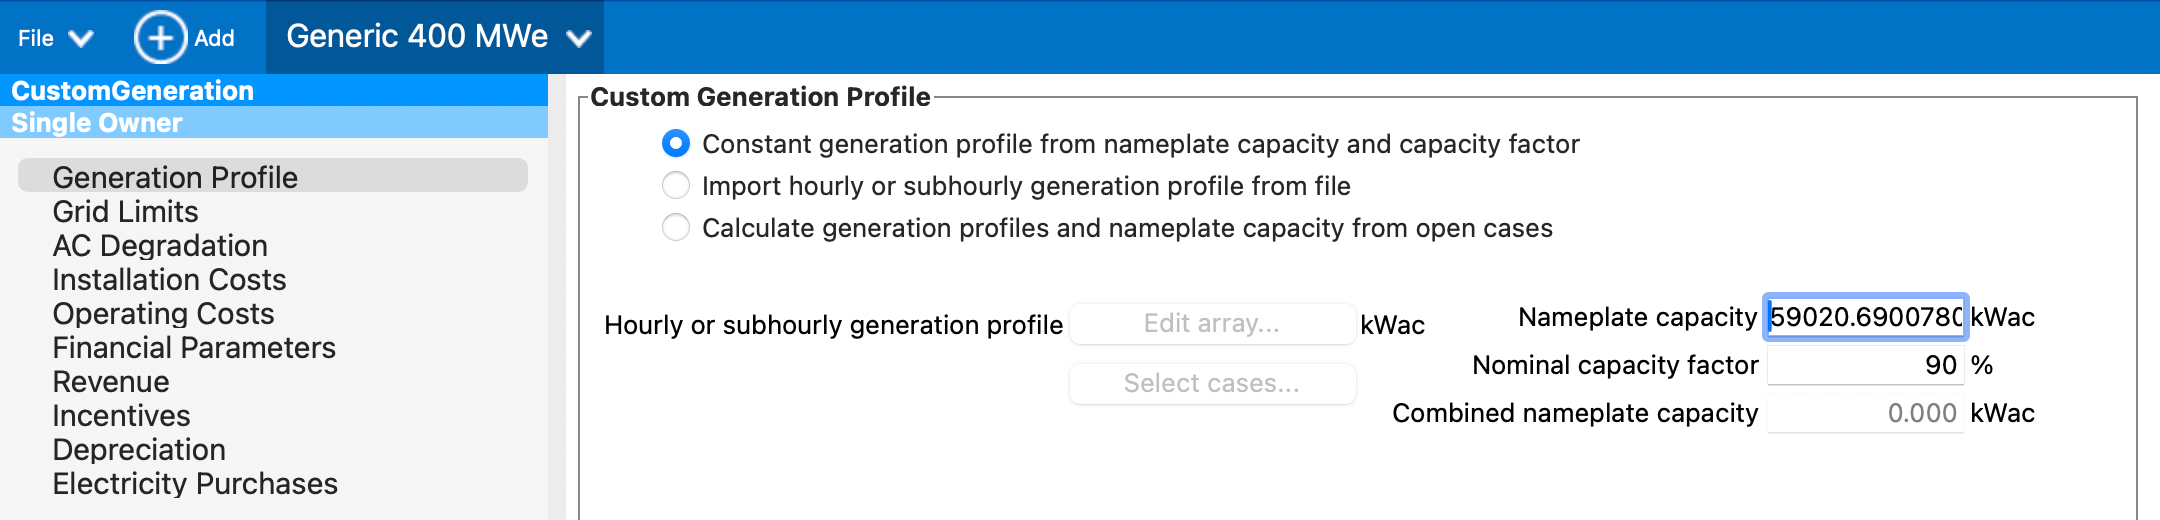
Re-creating SAM Economic Model Results in the SAM Desktop Application
First, open src/geophires_sam_economics/Generic_400_MWe.sam
in the SAM desktop application.
Next, run GEOPHIRES for your input, e.g.:
python -mgeophires_x my-geophires-input.txt
Then check src/geophires_x/all_messages_conf.log for the SAM Economics Parameter Mapping entry:
23-05-2025 10:09:35 : INFO : EconomicsSam : calculate_sam_economics : 151 : (Process Details : (1378, MainProcess), Thread Details : (8589068352, MainThread)): SAM Economics Parameter Mapping:
-----------------  --------------------  -------------------------------------------------------------------------------------------------------------------------------------------------------------------------------------------------------------------------------------------------------------------------------------------------------------------------------------------------------------------------------------------------------------
SAM Module         Parameter             Value
Custom Generation  analysis_period       20
Custom Generation  user_capacity_factor  90.0
Utility Rate       inflation_rate        2.0
Utility Rate       degradation           [1.2734946600673935, 0.7001040275842613, 0.5267634676194525, 0.4244824247238818, 0.3529717582311231, 0.29852256883429373, 0.2548483024454293, 0.21855974702202877, 0.18762922644042462, 0.1607514026827296, 0.13703877682895466, 0.11586181507372084, 0.09675857340703789, 0.07938054662917803, 0.06345865490418974, 0.0487810281945756, 0.03517801101748528, 0.02251175220012943, 0.010668799824934945, 0.0]
Single Owner       analysis_period       20
Single Owner       total_installed_cost  264606243.76608825
Single Owner       om_fixed              [7193902.821741002]
Single Owner       om_fixed_escal        -2.0
Single Owner       system_capacity       59020.69007804236
Single Owner       federal_tax_rate      [21.0]
Single Owner       state_tax_rate        [7.0]
Single Owner       itc_fed_percent       [30.0]
Single Owner       property_tax_rate     0.0
Single Owner       ppa_price_input       [0.08, 0.08, 0.08322, 0.08644, 0.08966, 0.09288, 0.0961, 0.09932, 0.10254, 0.10576, 0.10898000000000001, 0.1122, 0.11542, 0.11864, 0.12186, 0.12508, 0.1283, 0.13152, 0.13474, 0.13796]
Single Owner       debt_percent          40.0
Single Owner       real_discount_rate    8.0
Single Owner       term_tenor            20
Single Owner       term_int_rate         5.0
Single Owner       ibi_oth_amount        0.0
-----------------  --------------------  -------------------------------------------------------------------------------------------------------------------------------------------------------------------------------------------------------------------------------------------------------------------------------------------------------------------------------------------------------------------------------------------------------------
You can then manually enter the parameters from the logged mapping into the SAM desktop app.
Using SAM Economic Models with Existing GEOPHIRES Inputs
In many cases, all you need to do to use SAM Economic Models for your existing GEOPHIRES inputs is to change the
Economic Model parameter value.
For example, if your GEOPHIRES .txt file contained the following:
# *** Financial Parameters ***
Economic Model, 2, -- Standard Levelized Cost Model
Discount Rate, .05
Plant Lifetime, 25
You would change it to:
# *** Financial Parameters ***
Economic Model, 5, -- SAM Single Owner PPA Economic Model
Discount Rate, .05
Plant Lifetime, 25
For inputs with the BICYCLE economic model, such as the following:
# *** Financial Parameters ***
Economic Model, 3, -- BICYCLE
Inflated Equity Interest Rate, .08
Plant Lifetime, 30
Change Economic Model and replace Inflated Equity Interest Rate with a suitable Discount Rate and
Inflation Rate:
# *** Financial Parameters ***
Economic Model, 5, -- SAM Single Owner PPA Economic Model
Discount Rate, .08
Inflation Rate, .03
Plant Lifetime, 30